Using Infographics for Content Marketing
If your audience is scrolling fast and your content is fighting for attention, infographics can become your secret weapon. They turn dense information into clear, visual stories that people actually want to look at and share. Studies show that articles with infographics get significantly more views and engagement than text only content, and readers are more likely to remember what they saw when information is presented visually.
In content marketing, this matters a lot. You are not just trying to inform people, you are trying to keep them on the page longer, encourage shares, and build authority in your niche. When you integrate infographics into your strategy, you make your content more scannable, more link worthy, and easier to digest.
Why Infographics Work So Well
Infographics work because they align with how people naturally consume information online. The human brain processes visuals much faster than text, and color images increase the likelihood that someone will read content in the first place.
Visual content in general tends to outperform plain text in terms of engagement, but infographics add an extra layer. They combine data, design, and storytelling so that complex ideas feel simple and approachable. Instead of asking your audience to read a long block of text, you are guiding them through a visual journey where key points are highlighted and connections are obvious.
From a marketing standpoint, that means people are more likely to stay on your page, scroll further, and remember your message. It also makes your content more shareable on social platforms where visuals dominate the feed.
SEO and Traffic Benefits
Infographics are not just pretty add ons. They can meaningfully support your search and traffic goals. When you publish a well researched, well designed infographic, other sites are more likely to link to it as a reference, which boosts your domain authority and search performance.
Some research suggests that articles featuring infographics can receive far more inbound links and significantly more views than those without. This happens because infographics are easy for other creators to embed or reference when they are explaining a related topic. Each of those links sends positive signals to search engines and can drive referral traffic back to your site.
Infographics can also help your pages appear in rich search results like image packs and featured snippets when they are supported with good alt text, descriptive captions, and relevant context around them. That means your content is not only visible in standard results but may also show up in visual search or image tabs, which increases your overall reach.
Choosing the Right Topics for Infographics
Not every piece of content needs an infographic. The format shines when you are dealing with information that is either complex, data heavy, or process oriented.
Good candidates include:
- Step by step processes or frameworks that benefit from a visual flow
- Comparisons, such as product features or pricing tiers
- Data summaries from surveys, reports, or case studies
- Timelines, roadmaps, or customer journeys
When selecting topics, think about where readers tend to get stuck or overwhelmed in your existing content. If a section constantly needs extra explanation or feels dense, that is a strong hint it could turn into a valuable infographic. You can also choose topics that you want to rank for in search and use infographics to make those pages more compelling and distinctive.
Planning Your Infographic Structure
Before opening a design tool, outline the story your infographic will tell. A good infographic feels like a guided path, not a random collection of icons and numbers.
Start with a clear headline that answers “what is this about?” in simple language. Then draft a short introduction that frames the problem or question you are addressing. From there, group your information into logical sections, such as key statistics, steps, comparisons, or takeaways.
Think in terms of hierarchy. The most important ideas should be the most prominent visually, either through size, color, or placement. Supporting details should be present but not overwhelming. This structure helps readers scan quickly and still come away with the core message, even if they do not read every line.
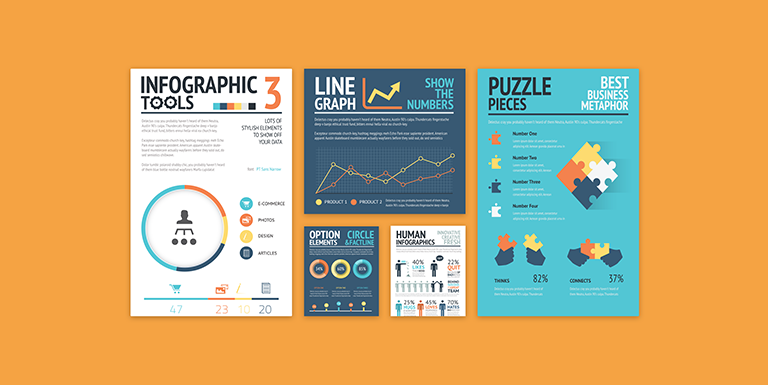
Design Best Practices for Infographics
Design is a big part of what makes an infographic feel professional and shareable, but you do not have to be a full time designer to get it right. A few practical principles go a long way.
Keep your color palette limited and consistent with your brand. This not only maintains visual cohesion but also reinforces brand recognition when your infographic is shared beyond your own channels. Use high contrast between text and background so everything remains easy to read, especially on mobile.
Choose simple, legible fonts and avoid using too many different styles. Varying size and weight is usually enough to create hierarchy without cluttering the design. Make good use of white space so that each section has room to breathe. When everything is packed tightly together, the visual impact and clarity suffer.
Visual elements like icons, charts, and illustrations should serve the content rather than decorate it. Use charts only when they clarify relationships or trends, not just to fill space. If you need help getting started, an infographic creator with templates can provide a solid foundation that you can adapt to your data and brand.
Integrating Infographics Into Your Content Strategy
Infographics work best when they are integrated into a broader content marketing plan, instead of being treated as isolated assets.
One effective approach is to pair each major blog post or cornerstone page with at least one supporting infographic. The infographic can summarize the entire post, break down a key section, or highlight important data. Readers who prefer visual content can get the gist quickly, while others can dive into the full article. This improves user experience and can increase time on page.
You can also repurpose infographics across multiple touchpoints. For example, a single long infographic can be sliced into several smaller panels for social media, used as slides in a presentation, or turned into graphics for email campaigns. This extends the life of your work and keeps your messaging consistent across channels.
Promoting Infographics for Maximum Reach
Creating a strong infographic is only half the work. To fully benefit, you need a plan for promotion and distribution.
Start by embedding the infographic in a relevant blog post with supporting text, context, and a clear call to action. Add social sharing buttons and, if it makes sense, an embed code that lets other sites easily feature it with a link back to your page. This can increase the number of backlinks and social shares you receive.
Share the infographic on your main social platforms, tailoring captions to each audience. On LinkedIn, you might focus on industry insights and professional value, while on Instagram or Pinterest you might highlight visuals and quick tips. Consider including infographics in your newsletters as well, where they can break up long text and draw attention to important sections.
If your infographic is tied to original research or strong data, reach out to relevant blogs, journalists, or industry sites that might find it useful for their own content. Well executed infographics often attract coverage precisely because they make the writer’s job easier when they need to explain something complex.
Measuring Performance and Improving Over Time
Like any marketing asset, infographics should be measured and refined. Tracking performance helps you understand what works and where you can improve.
Useful metrics include page views, time on page, scroll depth, and click through rates on pages that host infographics. You can also monitor how many backlinks a particular infographic earns, which sources are linking to it, and how often it is shared on social platforms.
If certain topics or formats consistently outperform others, use that insight to guide future projects. For example, you might discover that statistics heavy infographics resonate more with your audience than purely explanatory ones, or that comparison style visuals perform better on social channels. Over time, these patterns allow you to build a repeatable playbook rather than guessing each time.
Common Mistakes to Avoid
While infographics can be powerful, a few common pitfalls can limit their effectiveness. One is overcrowding. Trying to fit too much information into a single graphic makes it hard to read and defeats the purpose of simplifying content. Be willing to split a large idea into multiple related visuals if necessary. Another mistake is ignoring accessibility and SEO basics. Always include descriptive alt text, a textual summary on the page, and readable font sizes so that people and search engines can understand the content. Neglecting these elements can make your infographic invisible to assistive technologies and less likely to rank well in search.
Finally, avoid making infographics that are overly promotional. The strongest performers usually lead with value by educating, explaining, or informing, while letting brand recognition happen through subtle cues like logos and colors. If the graphic feels like a direct ad, people are less likely to share it and other sites are less likely to link to it. Infographics are not a magic shortcut, but when you use them thoughtfully, they can amplify your content marketing in a big way. They help you communicate complex ideas clearly, support your SEO and link building, and give your audience something worth sharing.